The Book of Blocks
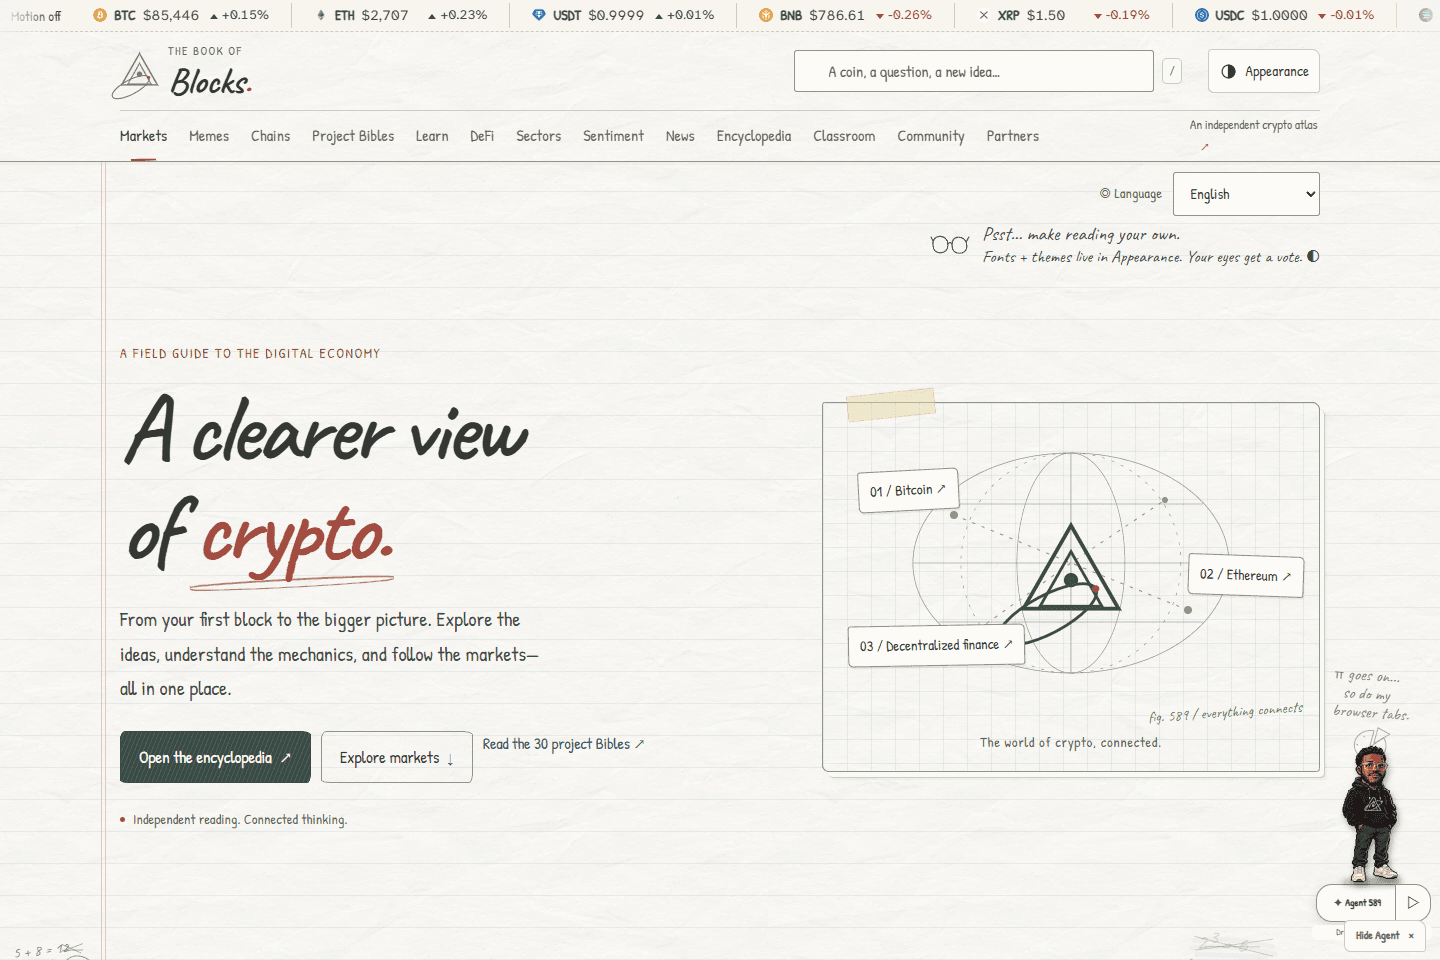
I built a reading library and live market observatory, bringing real-time data, researched content, and responsive interfaces into one Next.js application.
The problem I worked on
Crypto gives you plenty of numbers. Finding the story behind them takes more work. I built The Book of Blocks to connect market data with the definitions, project histories, and source material that help it make sense.
I organized the experience around different levels of detail: short definitions, longer project guides, and market views with charts and source links. That meant designing connections between content and data as well as building the individual screens.
This project is part of my work at Axiom Risk Group.
What I built
Reading interfaces
I connected definitions, learning paths, and longer readings through reusable page layouts. Focus view, larger text, and reading times support different reading preferences.
Structured project guides
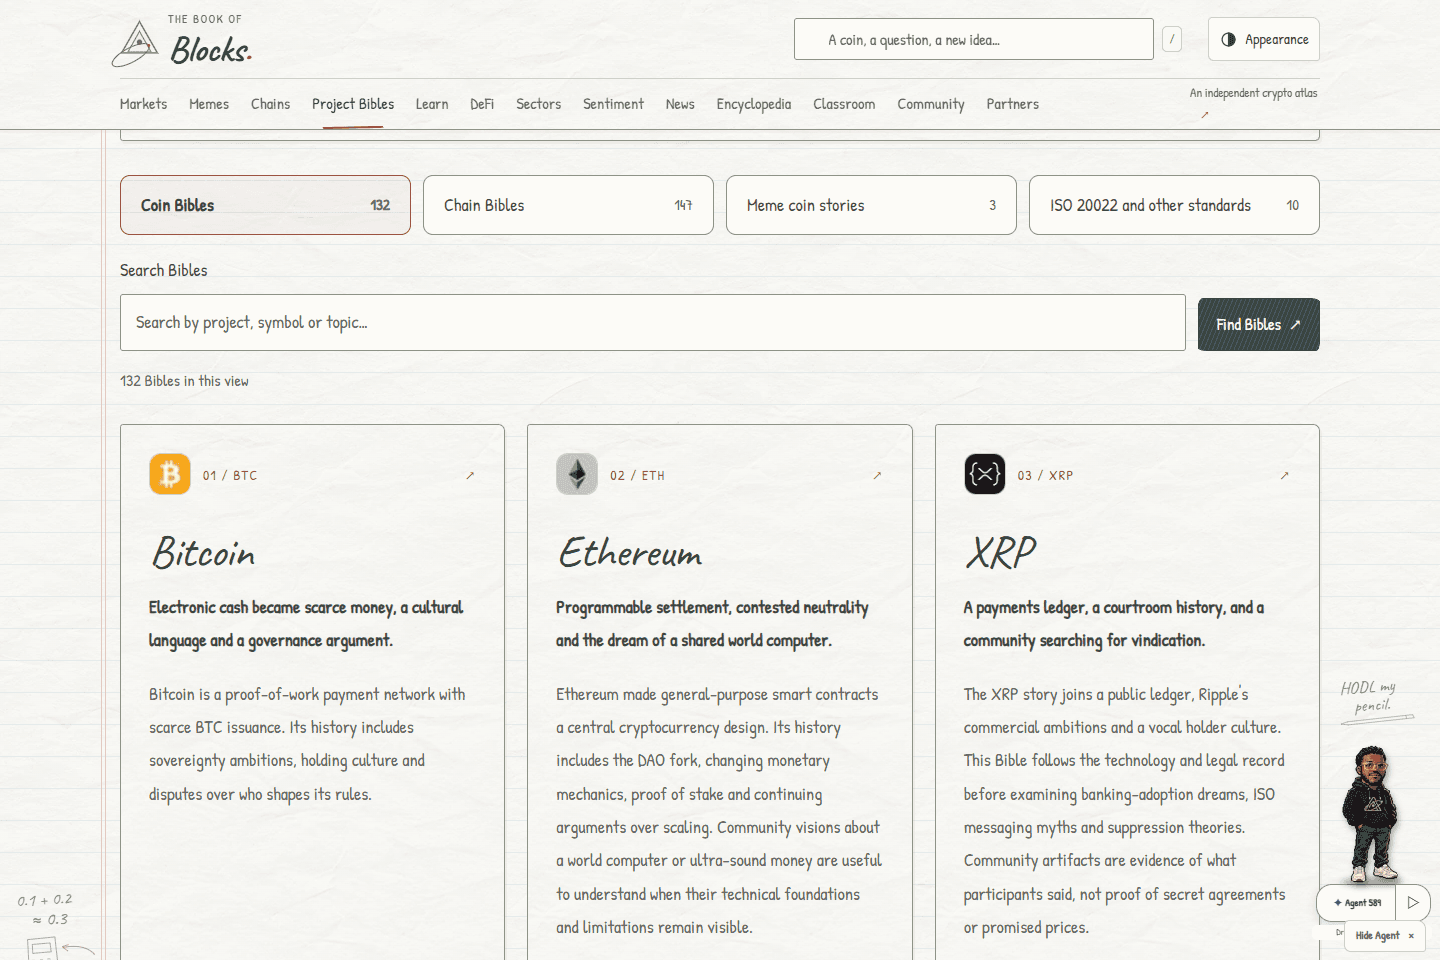
I built chaptered navigation for twenty project Bibles, including Bitcoin, Ethereum, XRP, and Solana. The presentation keeps source evidence close to the text and distinguishes claims from facts.
The market observatory
I brought rankings, sector filters, and a local watchlist into the market interface. Asset pages connect charts, statistics, exchange pairs, and news with their sources and timestamps.
Connected discovery
I connected views for chains, DeFi protocols, sectors, and sentiment. Agent 589 adds a draggable reading companion with questions and source links in the classroom.
The engineering
I separated live price updates from the reading content. Supabase Realtime distributes ticks, with subscriptions filtered to the assets in view. React updates the relevant market views, while TradingView Lightweight Charts renders history and selectable intervals.
A current quote and a stored daily snapshot can have different timestamps. I made that distinction visible through field labels and provenance, rather than treating every figure as equally fresh. Market views identify sources such as CoinGecko, exchange feeds, and Alternative.me.
The reading experience gets the same attention: connected entries, persistent appearance preferences, and a watchlist saved locally. Parchment and Observatory themes let readers choose the atmosphere that suits them.
The tech stack
| Technology | What it does |
|---|---|
| Next.js and React | App Router pages, reusable reading and market views, and interactive filters, charts, and guide controls. |
| Supabase Realtime | Broadcast subscriptions deliver price ticks to the interface, with updates filtered to the assets in view. |
| TradingView Lightweight Charts | Line and candlestick charts with selectable intervals. Historical candles arrive through an application API route. |
| Custom CSS | Responsive layouts, typography for longer reading, and the Parchment and Observatory appearance themes. |
| Browser storage | Keeps the watchlist and appearance preferences on the visitor’s device. |
| Vercel | Hosts the application and its API routes. |
Current chapter
The encyclopedia, project guides, and market observatory are live. Agent 589 currently uses the Blocks library and source links; classroom conversations last for the page session. Community contributions are planned and marked as coming soon.
Start with the encyclopedia or open the Project Bibles to explore the longer stories.
Hiring for full-stack or data-focused work?
I’d welcome a conversation about your engineering role. I can walk through the data flow, component design, and decisions behind this reading experience.